Unlike with the TI-83+ and TI-84+, it is relatively hard to perform statistics operations on the TI-89, TI-92+, and Voyage 200 the first time around. This tutorial demonstrates using the statistics functions available on this series of calculators to perform a linear regression on the same set of data as in the TI-83+ and TI-84+ Tutorial.
| X | 1 | 3 | 5 | 7 | 9 |
| Y | 10 | 31 | 55 | 73 | 94 |
Suppose X represents the number of workers in a certain factory and Y represents the number of widgets they are able to produce in an hour. Obviously, the more workers this factory has, the more widgets they will be able to produce. We can use a linear regression to determine the exact nature of this relationship by fitting a line to our data points.
First, your calculator must have the necessary software. If you have a TI-89 Titanium or other newer calculator, then you should have a Stats/List Editor icon on your Apps screen. Otherwise, you should have a Stats/List Editor application in your Flash Apps folder. (Reached by pressing then ). If you don’t have this software or you aren’t sure, you can download it here.
Next, start the Stats/List Editor application. For most calculators this can be reached by pressing then to get to the Flash Apps menu, then finding the application and pressing , though if your calculator has an APPS menu with icons, you don’t need to find a separate “Flash Apps” menu.
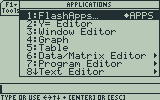
The apps menu on older calculators.
At this point, if you’re asked which folder you want to be in, just press to select the default (main). You will then be taken to the list editor, which is similar to that on the TI-83+/TI-84+ series of calculators.
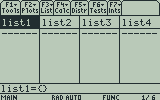
The TI-89/TI-92 Plus/V200 List Editor
We’re going to be using list1 and list2 for this tutorial–if either has data in it, clear the list by selecting the name with the arrow buttons and pressing , then . Now enter the X data into list1 and Y data into list2 by using the arrow buttons to select a cell, then pressing , typing in the corresponding number, and pressing again to confirm. The lists should automatically scale as you add more data.
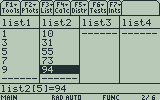
Data Entered into the List Editor
Once you are finished with entering the data into the list, press , , to select LinReg(ax+b). (You can alternately select a+bx if you prefer).
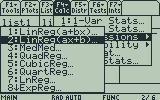
Regressions Menu on the TI-89/TI-92 Plus/V200
On the linear regression settings screen, enter list1 for X List and list2 for Y List. You can use 2nd ALPHA to enter alpha lock if you want, though when typing this, alpha lock isn’t very helpful. Also note that the button is its own button and doesn’t come in alphabetical order.
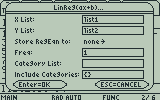
The linear regression settings screen
Leave the other settings the same and press to confirm. The results screen will be displayed.
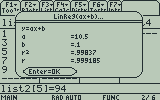
The linear regression output screen
This display means that our regression equation is Y = 10.5X+.1. Using this equation, we can say that we would expect X=4 workers to produce around Y=44 widgets, even though we have no actual data collected for X=4. Little r is the coefficient of correlation, which tells how closely the data is correlated to the line. r² is the coefficient of determination, and represents the percentage of variation in data that is explained by the linear regression. These numbers are extremely common in elementary statistics.
The calculator also creates another list, resid, with the residuals corresponding to each point. The residual represents the difference between the regression line and the original data point–the whole point of a linear regression is to minimize the squares of these values, thus ensuring the line which best fits the original data.
Afterwards, if you want to access your regression equation from the home screen, press 2nd from the home menu to access the VAR-LINK menu, select regeqn under STATVARS, press to paste it to the home screen, and press , , and to complete the expression. The output will be your regression equation.
